
Epigenome evolution may play key role in cancer progression
Cancer is a wily foe, and new research from Weill Cornell Medicine suggests certain types may be even more shifty and difficult to target than previously thought, due to continuous changes in cell programming.
Rapid cell growth and mutation is a hallmark of cancer, and changes in the genetic make-up of cancerous cells throughout the course of the disease – so-called somatic mutations - have been well studied.
But focus has recently shifted into epigenetic changes in cancer cells. If the gene contains the “hardware” of a cell, the epigenome is the “software” that must be layered on top of the genome for cells to function. The epigenome consists of multiple layers of chemical information that are continuously erased and rewritten as cells specialize in specific functions or undergo malignant transformation.
A team of scientists and computational biologists from the Sandra and Edward Meyer Cancer Center led an international collaboration between eight institutions which discovered that the cells of acute myeloid leukemia patients changed considerably between the initial diagnosis and when the cancer recurs after treatment, at remission. Strikingly, changes at the epigenetic level were more prevalent than at the genetic level. Their findings appeared in the journal Nature Medicine on June 20.
 Ari Melnick, M.D.
“There was profound reorganization of the epigenome at each point of treatment; leukemia cells seem to reshuffle the deck of cards completely,” said Ari Melnick, M.D., the Gebroe Family Professor of Medicine who co-led the study alongside computational biologist Christopher Mason, Ph.D. “This is paradigm shifting, because it shows that epigenetic clonal evolution is a key property of tumor cells with clinical and biological impact, independent of genetic evolution.”
Ari Melnick, M.D.
“There was profound reorganization of the epigenome at each point of treatment; leukemia cells seem to reshuffle the deck of cards completely,” said Ari Melnick, M.D., the Gebroe Family Professor of Medicine who co-led the study alongside computational biologist Christopher Mason, Ph.D. “This is paradigm shifting, because it shows that epigenetic clonal evolution is a key property of tumor cells with clinical and biological impact, independent of genetic evolution.”
It could also have significant impacts on treatment options and strategies, Mason said.
“Relying on genetic mapping alone underestimates the true diversity of these tumors,” Mason said. “In the future, cancers may need to be continually monitored for both genetic changes and epigenetic changes to understand where, and how, they are evolving.”
Acute myeloid leukemia (AML) is a fatal blood cancer that is particularly hard to treat because subpopulations of the cancer cells are resilient to chemotherapy; even when they appear to have been eradicated from the bone marrow, they return, often in a more aggressive form, causing relapse.
As in Darwin’s “survival of the fittest” theory of evolution, cancers that evolve to include a lot of genetic diversity within their cells are more likely to be able to survive under adverse conditions, such as chemotherapy. Many cancers produce subpopulations, or clones, as they evolve, and as a general rule of thumb, greater clonal complexity equates to worse patient outcomes.
AML is subject to a limited number of genetic clonal changes during disease progression, yet it is one of the most difficult cancers to treat. The Weill team wondered why.
“If it’s not the genetic complexity, there must be other factors that are contributing to the aggressive behavior of AML,” Melnick said.
Creating a "Cellular Barcode"

The collaborators studied DNA methylation – the process by which the cell’s DNA sequence is altered in a way that signals cells to express genes in different ways.
In particular, they focused on DNA methylation at C-G pairings, where the addition of a phosphate can create a phased epigenetic pattern – epiallele – that represents a “cellular barcode” the scientists could track as a way to measure epigenetic heterogeneity.
Using Methclone, a novel method developed by first co-author Sheng Li, Ph.D., while working between the Melnick and Mason labs, they traced these epialleles in blood samples from 138 patients. First co-author Francine E. Garrett-Bakelman led experiments which involved samples taken both at diagnosis and relapse, and in a single case, at three additional time points during disease progression.
“Across all five serial time points, a unique molecular portrait of cancer was found, showing novel genetic and epigenetic changes. This means that cancer continually and persistently evolves at multiple biological layers to resist therapy, and should thus be monitored and treated accordingly,” Mason said.
They found that the patients who fared the worst, with quicker times to relapse, were the ones with the greatest variation of epialleles. Meanwhile, their load of somatic mutations did not appear to make a difference, and the epigenetic changes seemed to evolve independently of any genetic changes.
The Weill team did further testing to see if certain areas of the gene, or loci, were more likely to be impacted by these changes, and noted substantial disruption of regions that would normally help regulate genes during disease progression. This result was present in bulk cells and also when examined in individual, single cells.
Additional analysis detected the upregulation of genes involved in protein synthesis and the enrichment of genes linked to inflammation and immune response – further study of these processes could shed light on how these cancers develop, Melnick said.
“Until now, it has been unclear whether epigenetic alleles and genetic alleles follow similar courses during disease evolution in AML,” said Li, an instructor of bioinformatics. “We were able to establish that tumor genetic and epigenetic heterogeneity in AML may arise as independent, biologically distinct phenomena, each presumably having a unique functional significance.”
Melnick said it might be possible to use Methclone analysis to detect AML and identify more aggressive disease. That, in turn, could direct treatment decisions.
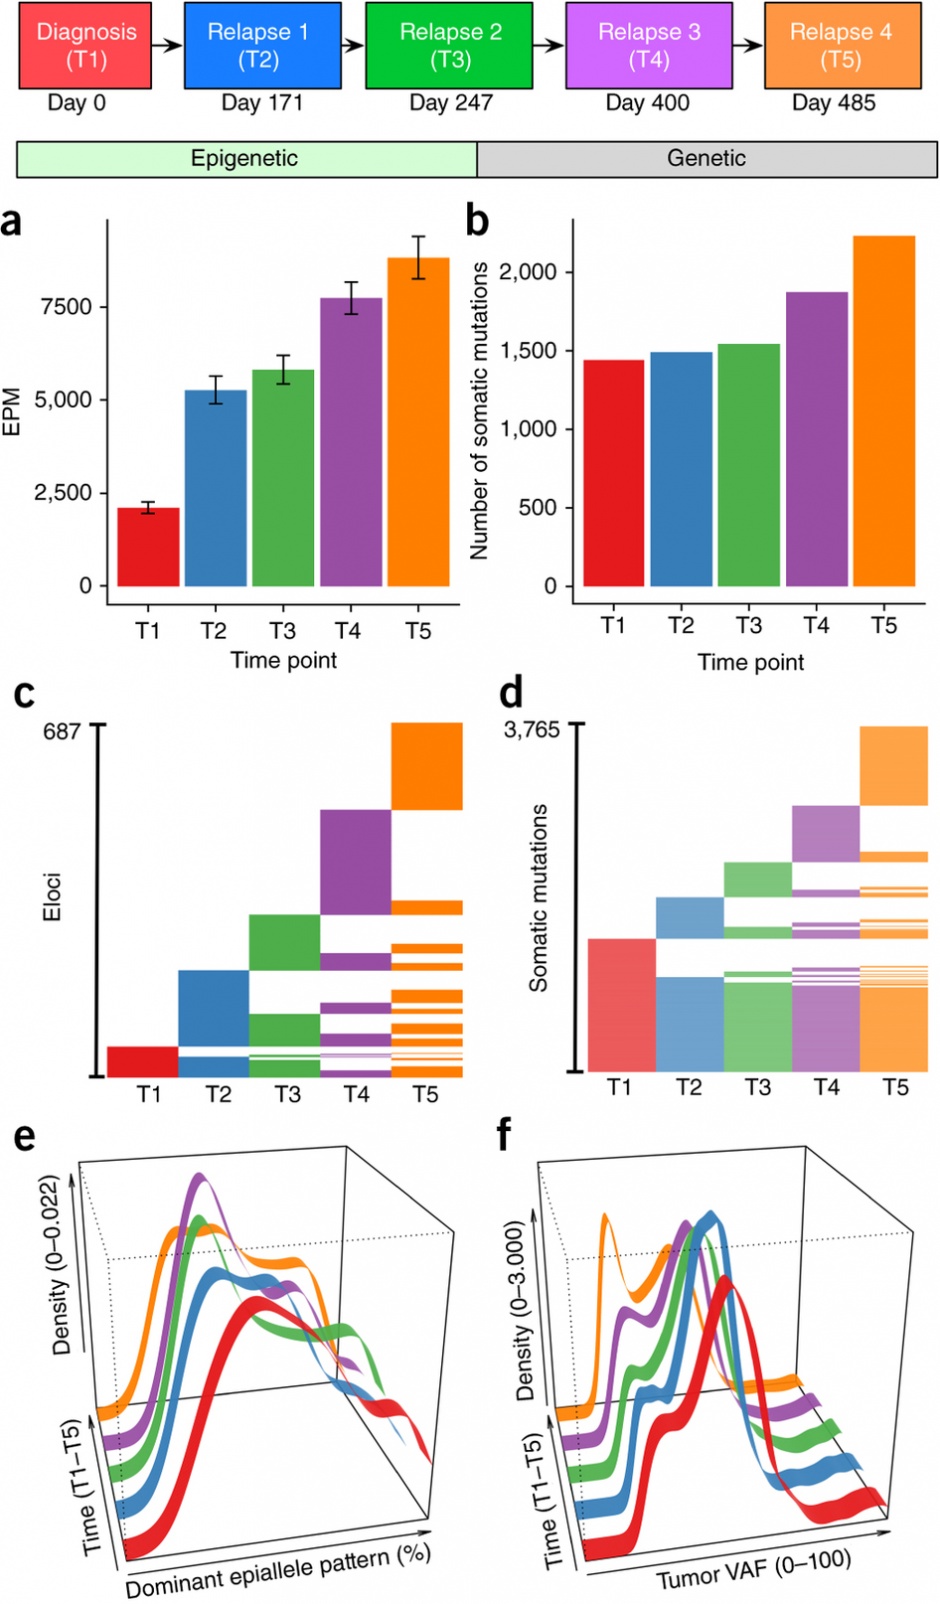 Assessment of epiallele shifts and genetic changes in serial samples from patient AML_130: (a) EPM in AML samples compared to NBM controls (n = 14) at time points T1–T5 (error bars, mean ± s.e.m.). (b) Somatic mutation burden at each time point. (c,d) Numbers of shared and unique eloci (c) and somatic mutations (d) among time points. (e) Density plot of the dominant epiallele frequency detected at eloci across all time points. (f) Density plot of the tumor VAFs detected at each time point.